|
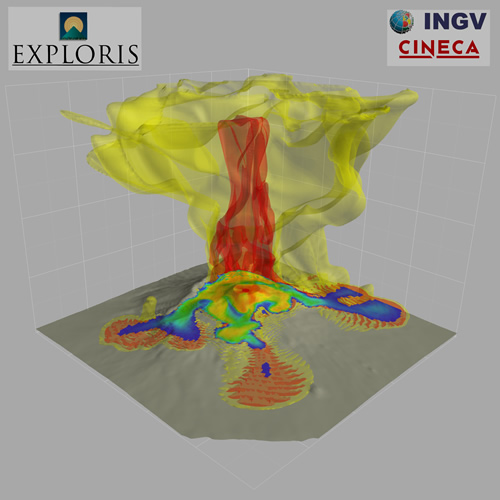
Example of three-dimensional view of the distribution of volcanic ash in the atmosphere and along the volcano flanks as produced by the 3D transient and multiphase flow code PDAC developed in the ambience of the EXPLORIS project. In detail, the figure refer to a sub-Plinian eruption of Vesuvius (Italy) and to about 1000 seconds after the collapse of the volcanic column. The red and yellow isosurfaces refer to volume concentrations of ash of 10-4 and 10-6, respectively. Colours on the volcano topography refer to the instantaneous distribution of pyroclastic flow temperature at the ground level (red and blue indicate about 950 and 50 °C, respectively).
|
 |
|||